Daily Milk
For herds with a meter configured for daily milk readings, this tab on the CowCard displays the animal's daily milk in a table and a graph. Though the table remains the same, you can change the graph style at any time by selecting the Bar Graph or Line Graph buttons:
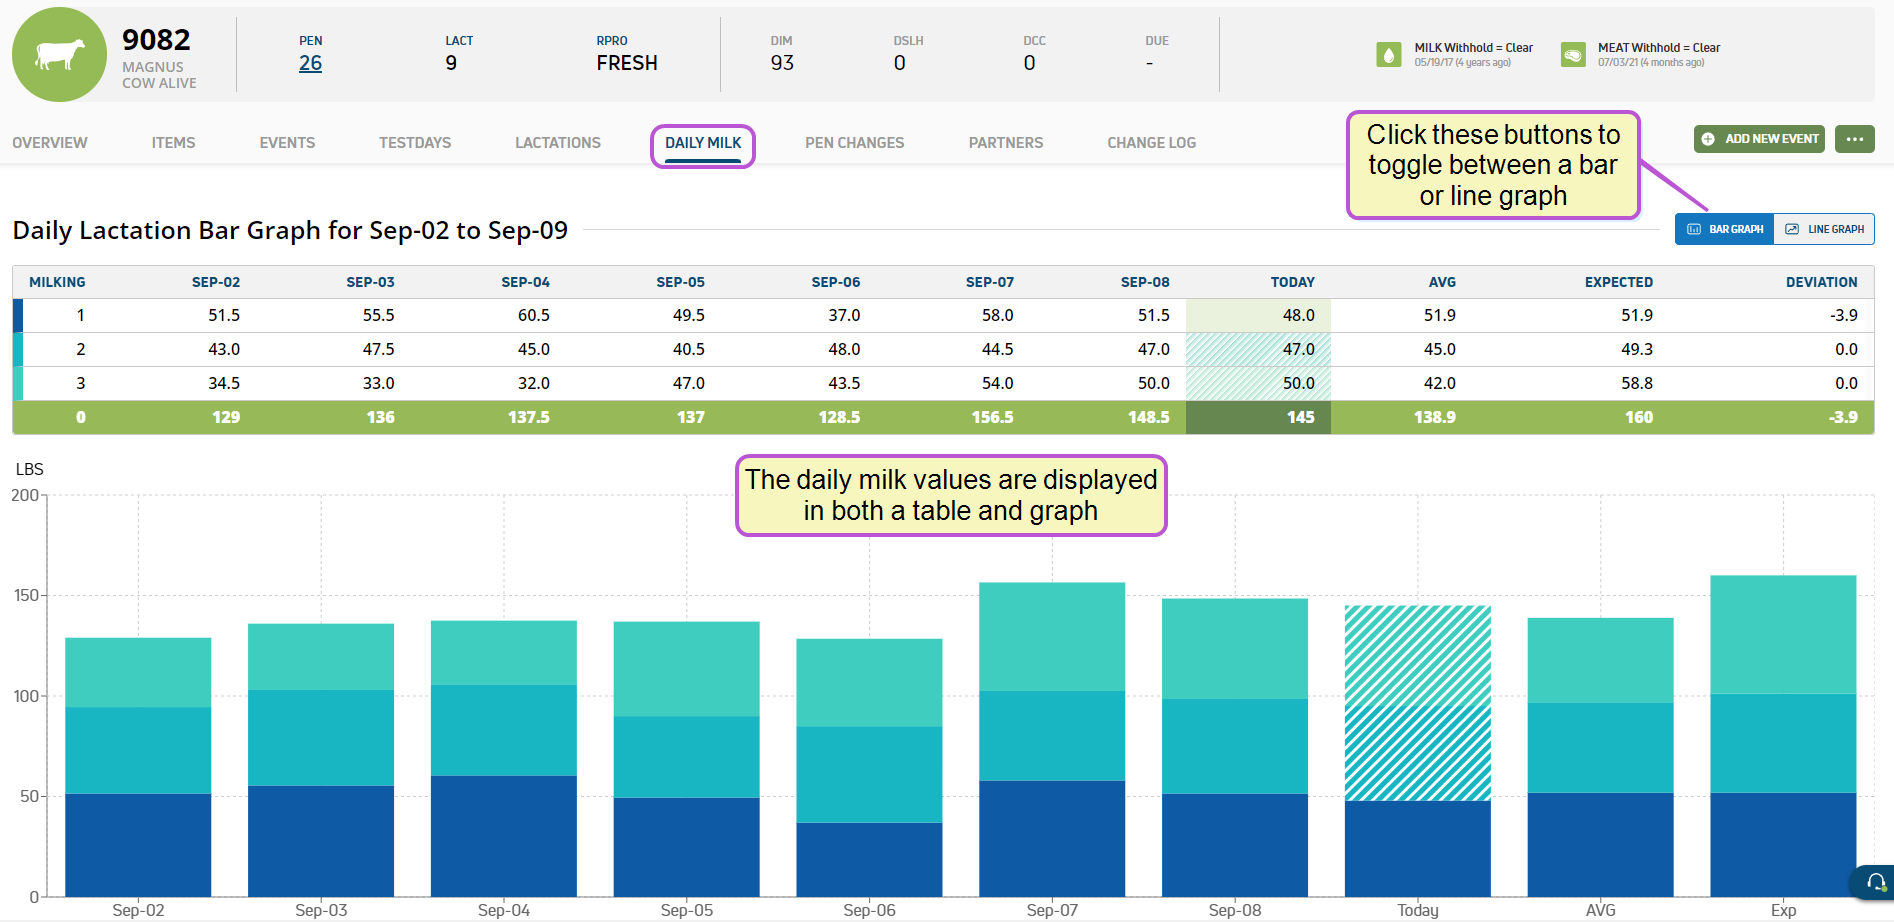
Expand the topics below to learn more about the functions and features of each graph style:
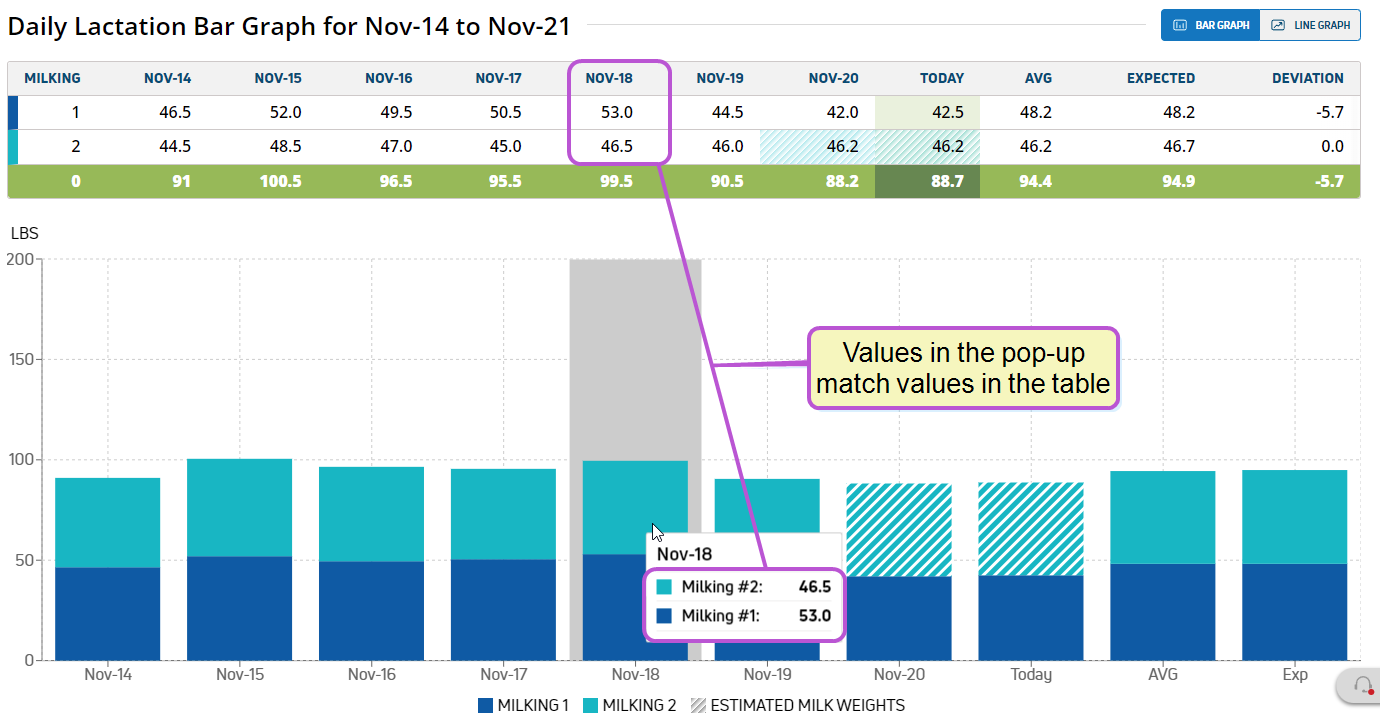
This graph lets you visually compare a recorded milk weight against other milkings from the same day and the weights from other days. Moving your cursor over a bar displays a pop-up with the weights from all recorded milkings that day:
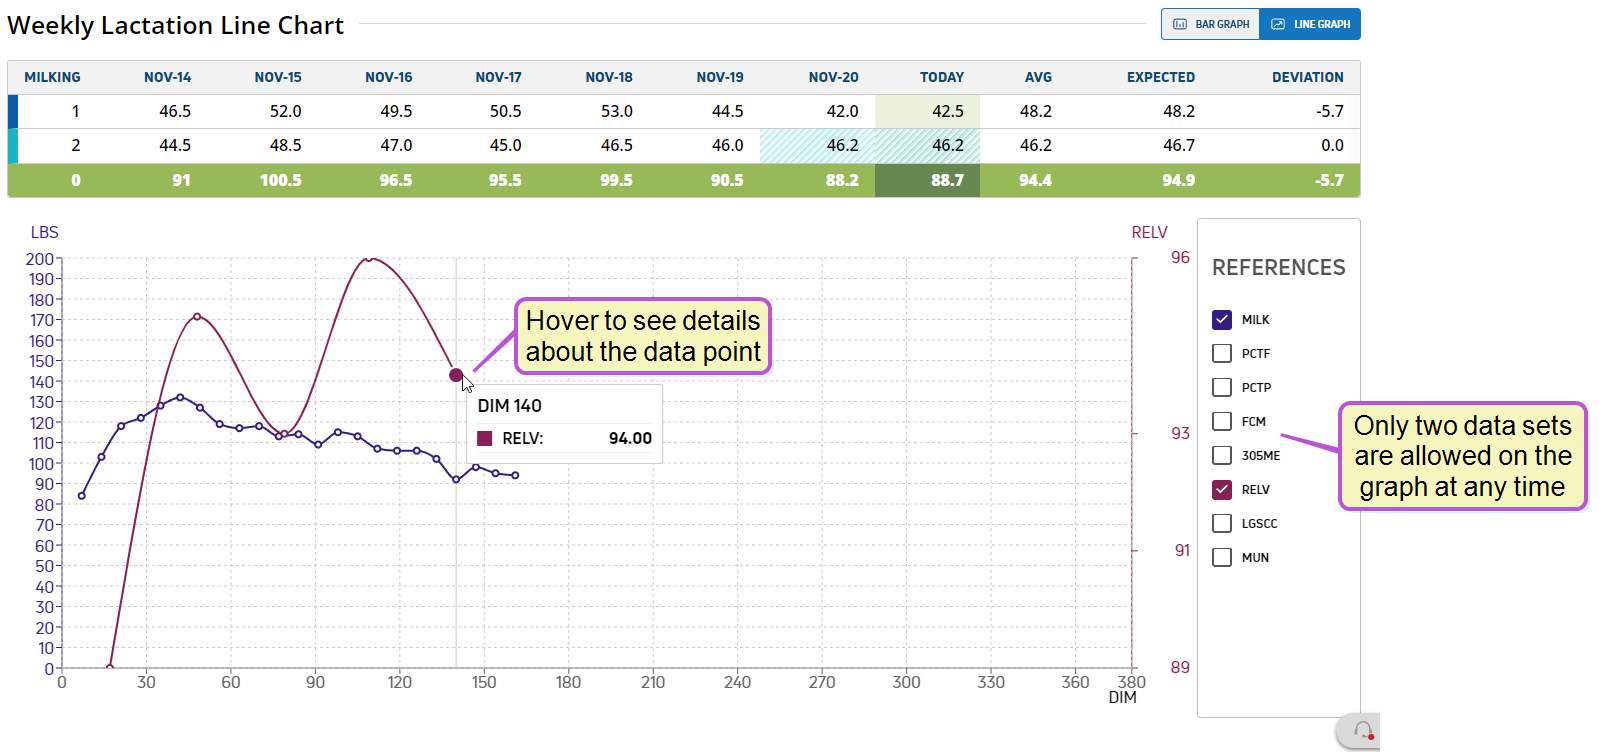
Similar to the graph found on the Lactations page, each point on the Milk line of the Weekly Lactation Line Chart represents the average milk weight recorded over the course of a week, as shown in the example below. When you check a box in the References section, a second line is added to the graph, and the graph adds a second y-axis related to the checked box. Note that you can only add one line to the graph at a time, and the Milk line is always included as a basis of comparison.
Moving your cursor over a point on either line graph causes the page to display a pop-up containing the data associated with that DIM![]() Days in milk:
Days in milk: