Reports History
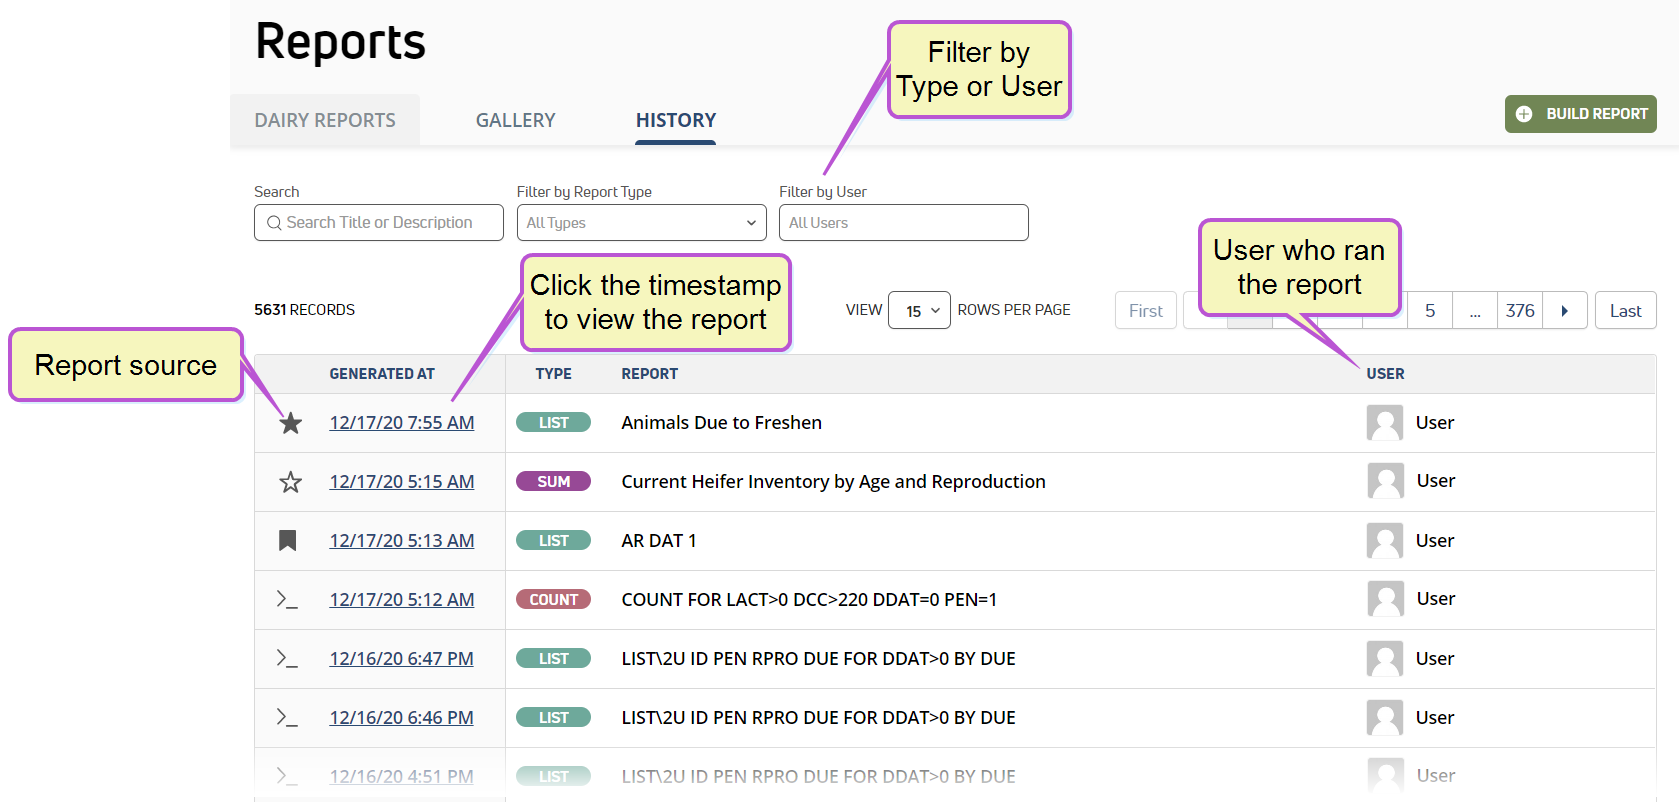
The Reports History page lists recently run reports for quick and easy access:
You can find this feature under the DairyComp, Reports menu.
Follow these guidelines when reviewing your Reports History:
- Click the report timestamp to view the report.
- Filter reports by Type or User.
-
Check the icon in the left column to identify the source of the report:
 Dairy Reports tab
  Reports Gallery tab
 PULSE Platform Command Line
  Saved command from PULSE Platform Command Line
 - Quickly check the report type by viewing its icon. There are currently four different report types supported in the PULSE Platform:

 Graphs the results of your report command.
 Generates a summary of your animal data based on the command conditions, and presents the data in a table or graph. Animal countsAverage valuesStandard deviationData range details, including minimum and maximum values The graph view is flexible and may be adjusted on the fly:
 - Check which user generated the report.