SUM Command Examples
The SUM command generates a summary of your animal data based on the command conditions, and presents the following details in a table or graph:
- Animal counts
- Average values
- Standard deviation
 A measure that is used to quantify the amount of variation or dispersion of a set of data values.
- Data range details, including minimum and maximum values
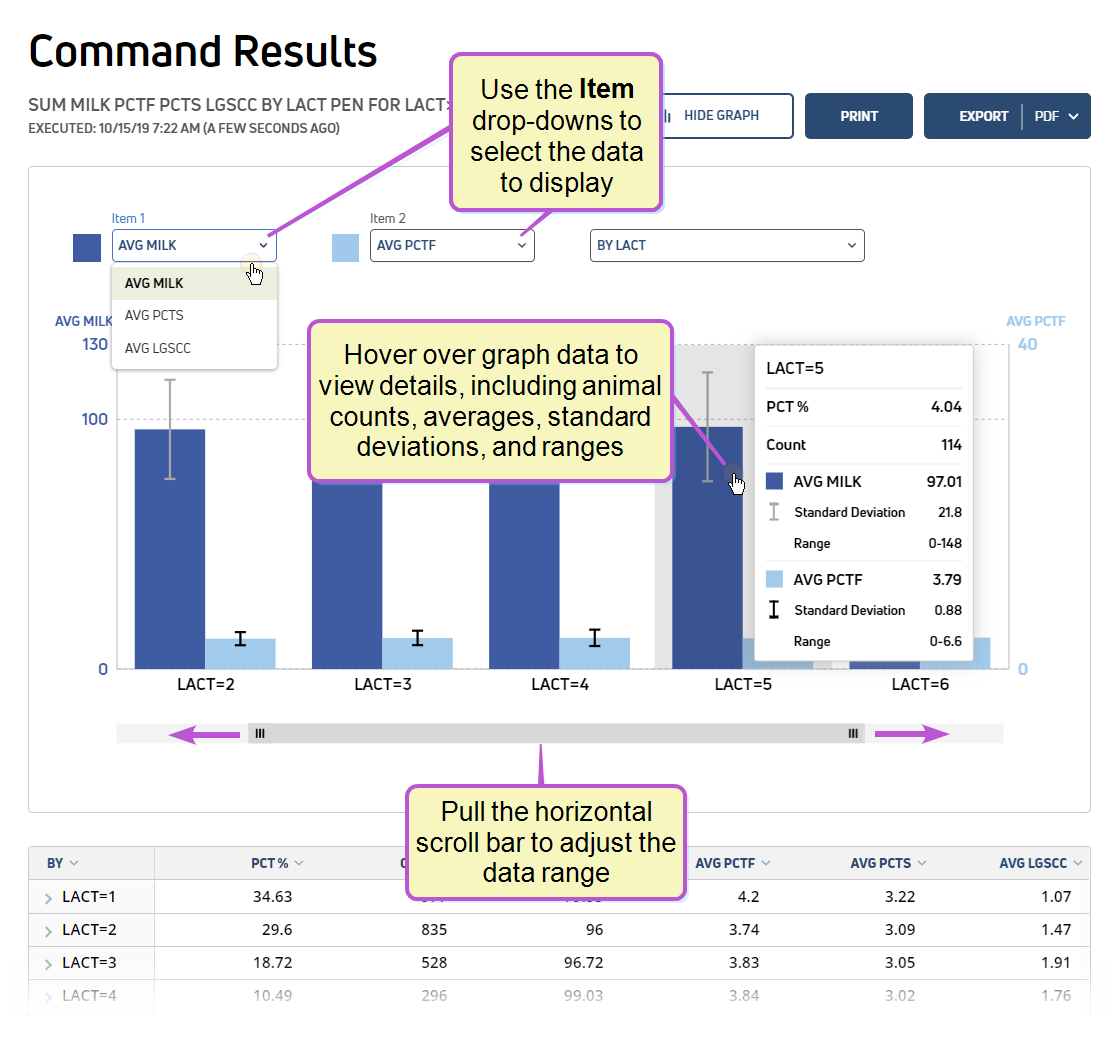
The graph view is flexible and may be adjusted on the fly:
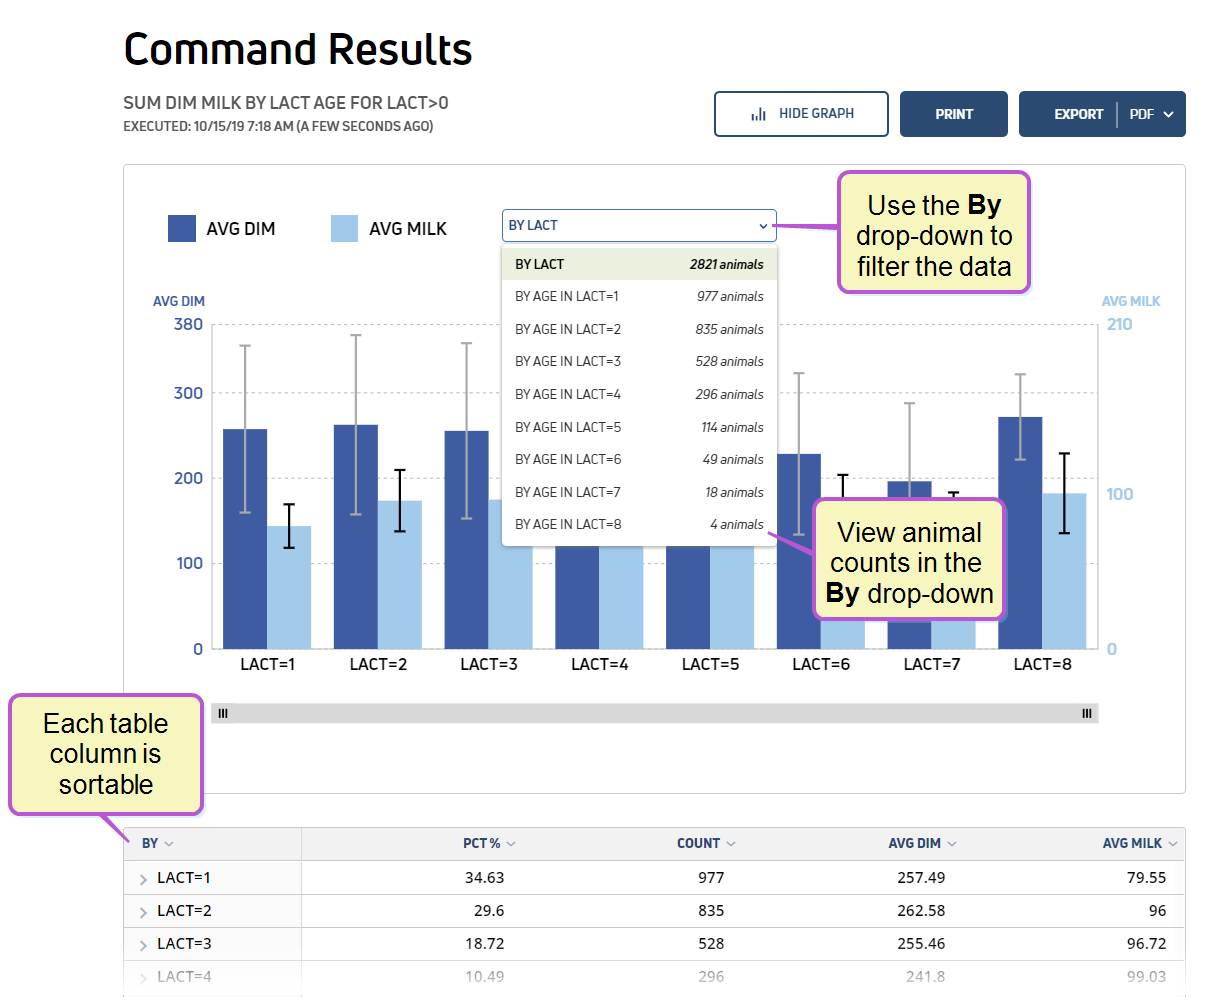
Additionally, each of the table columns allows for sorting to quickly customize your data view.
See the following SUM command examples:
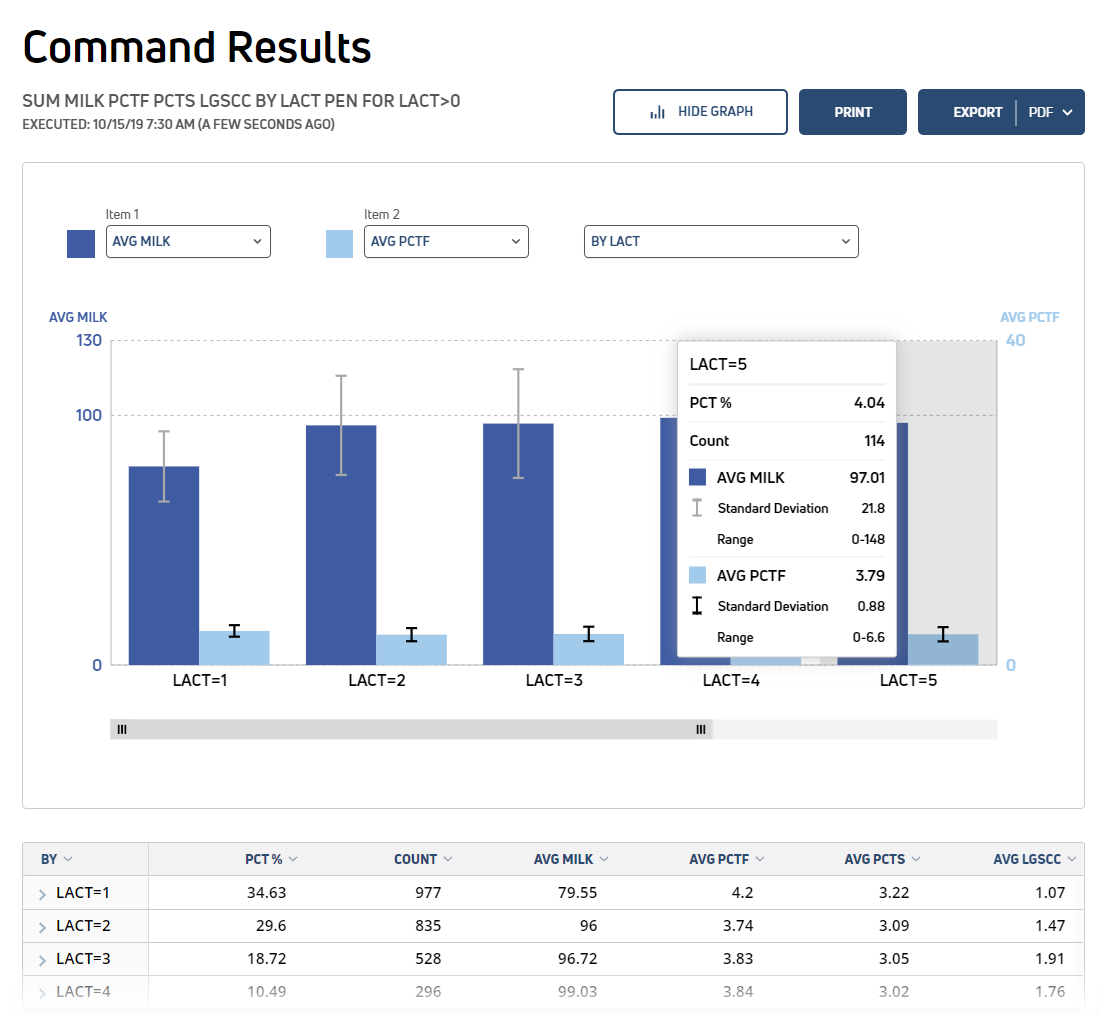
SUM MILK PCTF![]() Percent fat PCTS LGSCC BY lact PEN
Percent fat PCTS LGSCC BY lact PEN![]() Pen number FOR LACT
Pen number FOR LACT![]() Lactation number>0
Lactation number>0
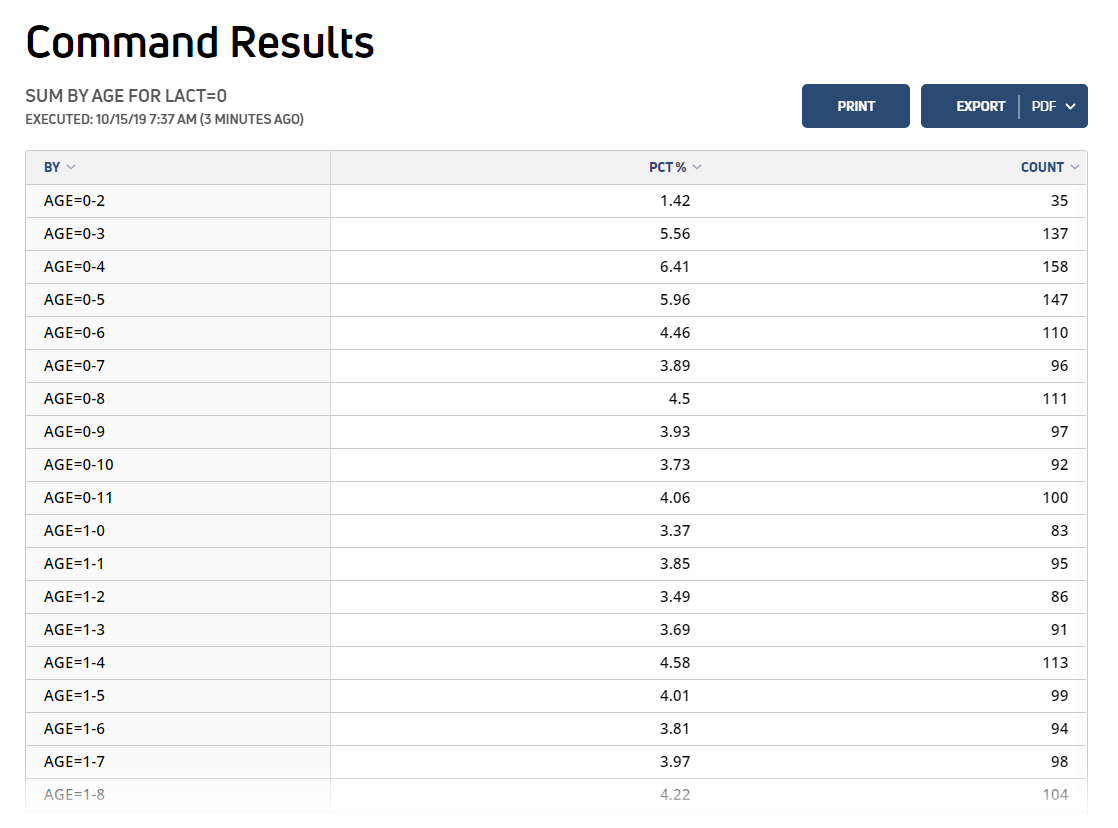
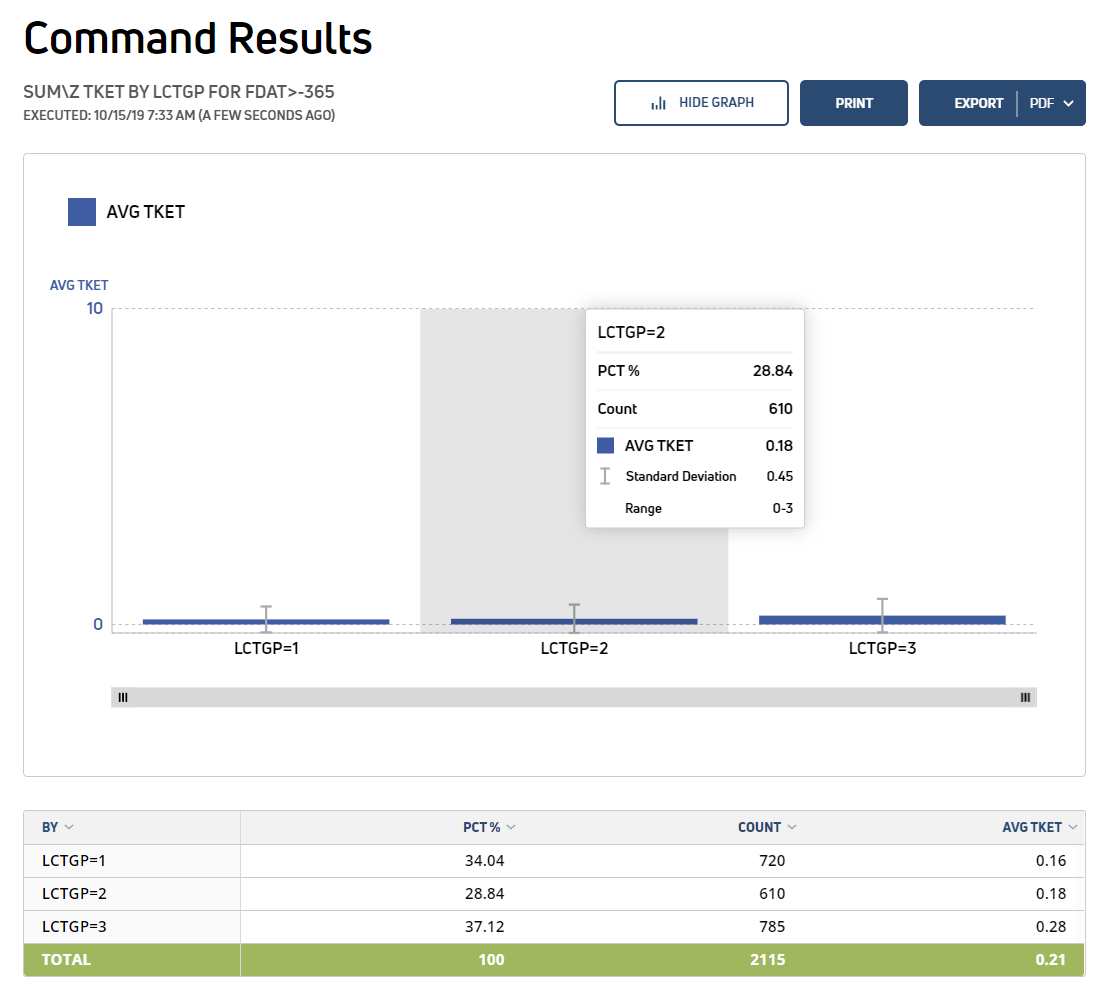
SUM \Z TKET BY LCTGP FOR FDAT![]() Fresh date>-365
Fresh date>-365
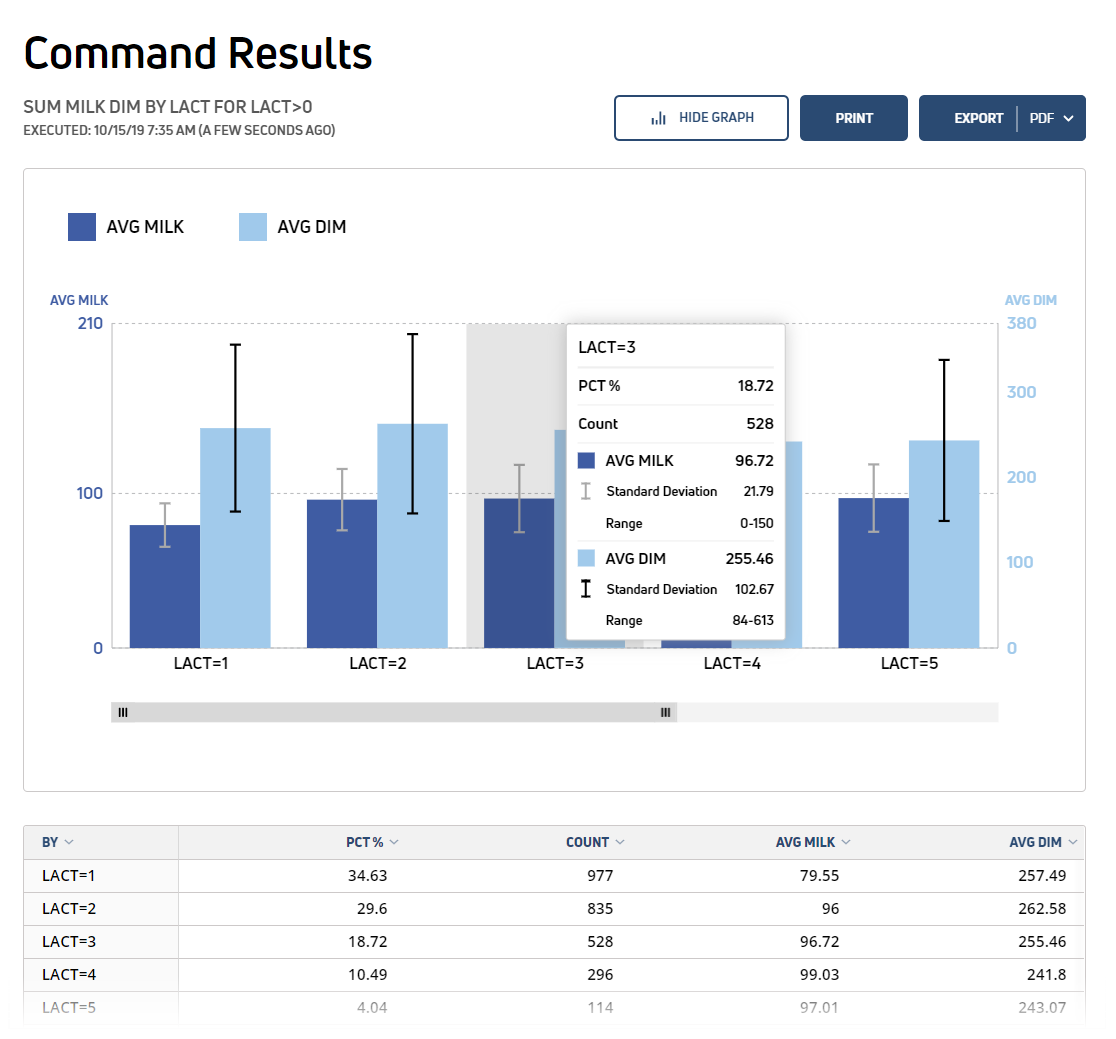
SUM MILK DIM![]() Days in milk BY LACT FOR LACT>0
Days in milk BY LACT FOR LACT>0